Introduction
Function graphing is an important skill for anyone who needs to work with mathematics. Being able to visually represent a function can be a huge advantage, especially when dealing with complex equations or large sets of data. In this article, we will provide a step-by-step guide to graphing functions for beginners.
Visualizing Mathematics: A Step-by-Step Guide to Graphing Function
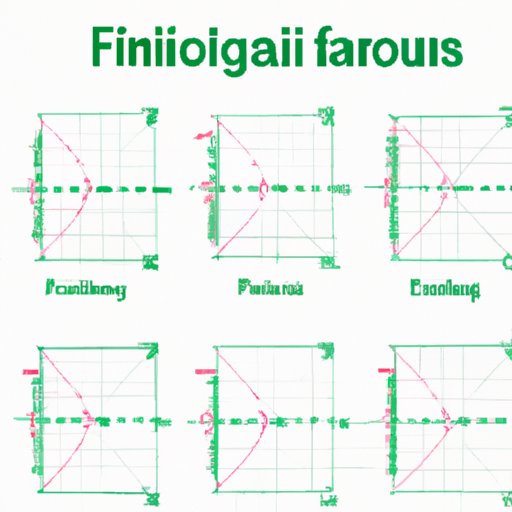
Before we begin, let’s define some basic components of a function graph. The graph is composed of two axes, typically labeled as the x-axis and y-axis, which intersect at the origin (0,0). The axes are separated by intervals of equal distances, which can be adjusted based on the range of the function to be graphed. Points on the graph represent input-output pairs, where the x-coordinate is the input, and the y-coordinate is the output. Lastly, a function graph may include curves that represent a set of points.
Now, let’s learn how to plot points on a graph using the x-y coordinate plane. Choose a set of values for x and evaluate the corresponding y values using the function. Once you have a set of ordered pairs, plot each point on the graph by placing a dot at the intersection of the x and y values. If you have enough plotted points, you can connect them with a curve to get a better sense of the shape of the function.
Some common functions that you may come across include linear, quadratic, and exponential functions. In a linear function, the graph is a straight line, and the equation is often written as y=mx+b, where m is the slope and b is the y-intercept. A quadratic function has a curved graph, and its equation is often written as y=ax^2+bx+c. An exponential function has a graph that is constantly increasing or decreasing, and its equation is often written as y=ab^x or y=a*e^x, where a and b are constants.
Become a Function Plotting Pro: An Easy-to-Follow Tutorial
Let’s walk through the process of graphing a function step-by-step. For this example, we will graph the function f(x)=x^2-2x+1. Start by labeling the x and y axes with appropriate intervals. Choose a range of x values to plot, and evaluate the function to find the corresponding y values. For example, when x=0, f(0)=1. When x=1, f(1)=0. When x=2, f(2)=1. When x=3, f(3)=4. Plot these points on the graph and connect them with a smooth curve to obtain the graph of the function.
When graphing a function, it’s important to choose appropriate axis scales. For example, if the function varies widely, adjusting the x-axis and y-axis intervals can help to better illustrate the detail of the function. Choose an interval that best aligns with the range of the function. It’s also important to make the graph visually appealing. This can be achieved by adding color, labels, and titles.
Graphing 101: Mastering Functions for All Levels
Trigonometric and logarithmic functions are more complex, but the same principles of graphing still apply. A trigonometric function is a periodic function with a range between -1 and 1, and its graph has a repeating wave-like pattern. A logarithmic function is defined as the inverse of an exponential function, and its graph often has an asymptote, where the curve approaches but never touches a vertical line.
When graphing a trigonometric function, important features to look for include the amplitude, period, and phase shift. The amplitude is the height of the curve from the center line, while the period is the length of one cycle. The phase shift is the horizontal shift of the curve. When graphing a logarithmic function, it’s important to identify the asymptote and whether or not the function is increasing or decreasing.
Using Technology to Simplify Function Graphing: A User-Friendly Guide
When learning how to graph a function, it can be helpful to use graphing calculators and computer software. Graphing calculators can quickly plot points, curves, and identify important features such as zeros and maxima/minima. Computer software such as Microsoft Excel or Desmos offer additional flexibility and advanced functions such as polar and parametric equations.
Recommended tools and resources include: TI-84 Graphing Calculator, GeoGebra, and MatLab. TI-84 provides comprehensive graphing solutions for students, teachers, and professionals alike. GeoGebra is an open-source algebra, geometry, trigonometry, and calculus platform that offers solutions to numerical, graphical, and statistical problems. MatLab is a powerful numerical computing platform that specializes in data analysis and modeling.
Graphing Made Simple: Tips and Tricks for Plotting Functions
Here are some additional tips and tricks to make function graphing even easier:
- Shortcut Methods: Using symmetry of the function, along with the scale of the axes, to sketch approximate graphs of functions
- Using Transformations: Adjusting the curve’s position in the coordinate plane through shifting, stretching, or compressing
- Identifying Symmetry: Recognizing whether the curve is symmetric with respect to the x-axis, y-axis, origin, or another line of symmetry
It’s important to keep in mind potential mistakes and pitfalls when graphing functions. These often relate to forgetting to include negative values, choosing an inappropriate scale for the axes, or ignoring important features that define the function’s shape.
Mastering the Art of Function Graphing: A Comprehensive Guide for Beginners
To master function graphing, practice is key. It’s important to embrace the mistakes and learn from them. Additional resources for readers who want to delve more deeply into the topic include textbooks such as Calculus by James Stewart and Precalculus by Ron Larson, as well as online courses like Khan Academy’s Algebra 2 and MIT OpenCourseWare’s calculus courses.
Conclusion
By now, you should have a basic understanding of how to graph a function. Remember to take your time and follow the steps carefully. With a little practice and some helpful guidance, anyone can learn to graph functions like a pro.


